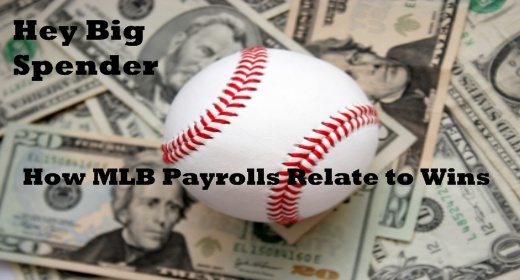
 You get what you pay for…Right? In terms of a TV, a new car, or dinner at a restaurant perhaps; but what about with an MLB Franchise? Does spending more money really mean more wins? We are going to look at two key figures today, team payroll and team wins and see if there really is a correlation between the two.
*EDITOR’S NOTE: This data has been updated for the 2012 season.
Big Spenders & Cheapskates
When we think of teams that spend big, one name comes to mind – the New York Yankees. The Bronx Bombers spent $98 Million in player salary last year. It resulted in 95 wins which was good for second most in all of Major League Baseball last year. On the opposite end of the spectrum lies the San Diego Padres. They spent a tick over $55 Million in salary last year for a grand total of 76 wins.
MLB Payroll Averages
We won’t concern ourselves with figuring out the average amount of wins each MLB team had – there is a winner and loser each game so that number is easy to find (81). The next number to find is the average MLB team’s payroll. If you divide the total number of dollars spent on player salary in 2010 by the 30 teams in the league, we come away with an average payroll of a little over $98 Million. The Yankees spend more than twice that on salary and the Padres spend just over half that amount. Just based on some basic baseball knowledge, it’s not surprising that the Yankees consistently have a competitive team –they spend a ton of money. It’s also not surprising that the Padres have been consistently bad for the past few years – they hardly spend a dime.

Average Cost Per Win
How much is winning a Major League Baseball game worth? Well to some teams it is worth a lot more than to others. We find the average cost per win by dividing the total payroll of a team by the number of wins that team acquired over the season. The Yankees spent the most money per win at $2.08 Million while the Oakland Athletics got their wins for dirt cheap at about $590,000 per win. The average MLB team spent about $1.22 Million per win in 2012. So what do all of these figures tell us? Well, besides looking pretty, they don’t tell us a whole lot just yet. Because the scale is vastly different (a max of $198 Million dollars compared to a max of 162 wins just doesn’t give us two very comparable figures), we must look instead to how well each team did compared to the league average.
Number of Wins +/- MLB Average
Again, the average number of wins in Major League Baseball for 2012 was 81. Some teams obviously did better and some did worse. The Nationals had the best record in the Majors which put their win total at 21% above the league average – pretty impressive. The Astros had the league’s worst record at a paltry 32% below the league average.
Amount of Salary +/- MLB Average
Lastly we want to look at the amount of salary paid out above or below the league average. The Yankees spent an astonishing 102% more than the league average on salary which netted them 17% more wins than average. Not exactly a 1-1 ratio but they play in a competitive division. The Padres spent 44% less money on salary in 2012 but only saw a difference of -6% wins off league average. Hey, they aren’t spending money, but they aren’t losing as much as we’d expect either.
All the Numbers We Discussed Sorted by Highest Payroll
|
TEAM |
Total Team Payroll |
Payroll +/- League Average |
Wins |
Wins +/- League Average |
$/Win |
$/Win +/- League Average |
| New York Yankees |
$198.0M |
102% |
95 |
17% |
$2.08M |
72% |
| Philadelphia Phillies |
$174.5M |
78% |
81 |
0% |
$2.15M |
78% |
| Boston Red Sox |
$173.2M |
77% |
69 |
(15%) |
$2.51M |
107% |
| Los Angeles Angels |
$154.5M |
58% |
89 |
10% |
$1.74M |
43% |
| Detroit Tigers |
$132.3M |
35% |
88 |
9% |
$1.5M |
24% |
| Texas Rangers |
$120.5M |
23% |
93 |
15% |
$1.3M |
7% |
| Miami Marlins |
$118.1M |
20% |
69 |
(15%) |
$1.71M |
41% |
| San Francisco Giants |
$117.6M |
20% |
94 |
16% |
$1.25M |
3% |
| St. Louis Cardinals |
$110.3M |
13% |
88 |
9% |
$1.25M |
4% |
| Milwaukee Brewers |
$97.7M |
(0%) |
83 |
2% |
$1.18M |
(3%) |
|
TEAM |
Total Team Payroll |
Payroll +/- League Average |
Wins |
Wins +/- League Average |
$/Win |
$/Win +/- League Average |
| Chicago White Sox |
$96.9M |
(1%) |
85 |
5% |
$1.14M |
(6%) |
| Los Angeles Dodgers |
$95.1M |
(3%) |
86 |
6% |
$1.11M |
(9%) |
| Minnesota Twins |
$94.1M |
(4%) |
66 |
(19%) |
$1.43M |
18% |
| New York Mets |
$93.4M |
(5%) |
74 |
(9%) |
$1.26M |
4% |
| Chicago Cubs |
$88.2M |
(10%) |
61 |
(25%) |
$1.45M |
19% |
| Atlanta Braves |
$83.3M |
(15%) |
94 |
16% |
$0.89M |
(27%) |
| Cincinnati Reds |
$82.2M |
(16%) |
97 |
20% |
$0.85M |
(30%) |
| Seattle Mariners |
$82.0M |
(16%) |
75 |
(7%) |
$1.09M |
(10%) |
| Baltimore Orioles |
$81.4M |
(17%) |
93 |
15% |
$0.88M |
(28%) |
| Washington Nationals |
$81.3M |
(17%) |
98 |
21% |
$0.83M |
(31%) |
|
TEAM |
Total Team Payroll |
Payroll +/- League Average |
Wins |
Wins +/- League Average |
$/Win |
$/Win +/- League Average |
| Cleveland Indians |
$78.4M |
(20%) |
68 |
(16%) |
$1.15M |
(5%) |
| Colorado Rockies |
$78.1M |
(20%) |
64 |
(21%) |
$1.22M |
1% |
| Toronto Blue Jays |
$75.5M |
(23%) |
73 |
(10%) |
$1.03M |
(15%) |
| Arizona Diamondbacks |
$74.3M |
(24%) |
81 |
0% |
$0.92M |
(24%) |
| Tampa Bay Rays |
$64.2M |
(35%) |
90 |
11% |
$0.71M |
(41%) |
| Pittsburgh Pirates |
$63.4M |
(35%) |
79 |
(2%) |
$0.8M |
(34%) |
| Kansas City Royals |
$60.9M |
(38%) |
72 |
(11%) |
$0.85M |
(30%) |
| Houston Astros |
$60.7M |
(38%) |
55 |
(32%) |
$1.1M |
(9%) |
| Oakland Athletics |
$55.4M |
(44%) |
94 |
16% |
$0.59M |
(51%) |
| San Diego Padres |
$55.2M |
(44%) |
76 |
(6%) |
$0.73M |
(40%) |
Of the 20 teams that pay less than the league average in salary, 10 had more wins than losses. One (1) of those teams had a .500 season, quite a surprising set of data.Of the 10 teams that pay more than the league average in salary, two (2) of them had losing seasons. One (1) of those teams had a .500 season, not what you’d expect from the league’s top spenders.*Payroll Figures Courtesy of USA Today, Win Totals Courtesy of ESPN Stats*
Who are the Payroll Winners?
Starting at the bottom, we will work our way up and it doesn’t take us long to find our first winner. The Athletics pay 44% less salary than the average team in the league and came away with 94 wins. This equates to nearly a +60% difference in salary and wins (a definite good thing). The Tampa Bay Rays paid 46% less in salary than the average MLB team and also came away with 90 wins, a +38% differential. Lastly, the Washington Nationals, owners of the best record in baseball, actually spent 17% less in salary than the average team. That’s good enough for a 31% differential.
Who are the Payroll Losers?
Starting at the top and working our way down, we first come across the Boston Red Sox, the highest paying team with a losing record. They had 15% fewer wins and paid 77% more salary than average for a grand total of -92% differential. Next up are the Miami Marlins who received 15% fewer wins than average while paying 20% more than average for a -35% differential.
What we Learned
Ok, so we learned that spending a lot of money will get you wins, but not all the time. Generally, going cheap on payroll will mean a losing season but not every time either. More important than salary or superstars is a team’s ability to draft well, groom young players in the minors, and understand which players are worth the money and which aren’t.
Interesting. But here’s my question. If A-Rod leaves New York by train at 5pm going south towards Baltimore, traveling 55mph. And Jeter leaves Palm Beach by car at noon going west towards Tuscalosa in traffic. How many hot dogs can CC Sabathia eat before they give Notre Dame a one seed in the tournament?
Go Dodgers!
Sorry your Fighting Irish didn’t get a number 1 seed this year. A 2 seed is just as good until the part when they have to face Kansas. Go Dodgers!